Looker Studio • Power BI • Tableau
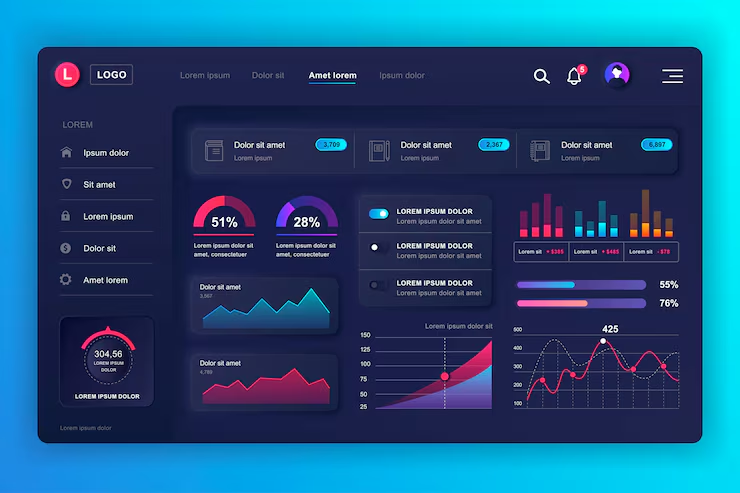
Dashboards That
Drive Decisions
Interactive, auto-refreshing analytics dashboards in Looker Studio, Power BI, and Tableau — connecting all your data sources into a single, live view that eliminates manual reporting and surfaces insights instantly.
500+Dashboards Built
10hrAvg Delivery Time
98%Client Satisfaction
Share Your Requirement
Analytics Tools We Master


What We Build
Comprehensive Dashboard Services
Looker Studio Dashboards
Interactive Looker Studio (Google Data Studio) dashboards connecting Google Analytics, Ads, Search Console, Sheets, BigQuery, and 500+ data sources — auto-refreshed, shareable, and branded.
Looker StudioGoogle AdsGA4BigQuery
Power BI Dashboards
Executive-grade Power BI dashboards with DAX measures, drill-through reports, row-level security, and embedded analytics — connecting to SQL databases, Azure, Salesforce, and Excel data sources.
Power BIDAXAzureSQL Server
Tableau Visualisations
Beautiful Tableau dashboards and data stories with advanced chart types, calculated fields, parameters, and Tableau Server/Online publishing for organisation-wide analytics access.
TableauTableau ServerCalculated FieldsData Stories
Real-Time & Automated Dashboards
Live, auto-refreshing dashboards connected to your databases and APIs — eliminating manual data pulls and ensuring every stakeholder always sees current, accurate data without analyst intervention.
Real-Time DataAPI ConnectionsAuto-RefreshAutomation
Multi-Source Data Integration
Unified dashboards pulling from multiple data sources — CRM, ERP, marketing platforms, e-commerce databases, and spreadsheets — consolidated into a single source of truth for your business.
Data IntegrationETLAPIsMulti-Source
Dashboard Training & Handoff
Comprehensive dashboard training — enabling your team to interpret, filter, and extract insights independently, with documentation and video walkthroughs for ongoing self-service analytics.
TrainingDocumentationSelf-ServiceHandoff
Meet Your Analytics Experts

Hello, I'm
Ananya
Looker Studio & GA4 Dashboard Expert
A Google ecosystem analytics specialist who has built 200+ Looker Studio dashboards for marketing teams, e-commerce businesses, and agencies. Ananya's dashboards are known for their visual clarity, logical layout, and connection to complex multi-source data — consistently earning praise from both technical and non-technical stakeholders.
Recent Success Stories
Multi-Source Looker Studio Dashboard
Marketing Reporting: 4 Hours → 10 Minutes
24x Faster Reporting

Power BI + ERP Integration
Finance Dashboard: Live Board Reporting
2-Day Prep Eliminated

Tableau Operations Dashboard
Ops Dashboard: Same-Day Issue Detection
15 KPIs, 4 Departments
What Our Clients Say
"We had data scattered across Google Ads, Facebook, Shopify, and a custom CRM. Protechplanner built a single Looker Studio dashboard pulling all sources into one view — updated every hour. Our weekly reporting that took 4 hours now takes 10 minutes. The visibility has transformed how our team makes decisions."

Paige Sherman
Head of Marketing, GrowthFirst
"The Power BI dashboard Protechplanner built connects our ERP, Zoho CRM, and Excel forecasts. The DAX measures for margin analysis are exactly what our finance team needed. Board reporting went from 2 days of preparation to a live dashboard our directors access in real time. Extraordinary ROI."

Aryan Kapoor
CFO, RetailX
"Operations dashboards are complex — we have 15 KPIs across 4 departments. Protechplanner delivered a Tableau dashboard with perfect drill-through from summary to individual order level. Our operations managers now catch issues same-day instead of discovering them in the weekly review."

Rachel Kim
COO, LogiStar
Get Started
Your Data,
Always Visible
Stop chasing data in spreadsheets. Our analytics experts will build you a live dashboard where every key metric is always one click away.